![]()
A Better Future with Python
Dr. Yves J. Hilpisch
The Python Quants GmbH
EuroPython, Florence, 03. July 2013
Better Future
Progress
How can economic and/or social progress be measured?
- Efficiency – use less resources for a given output
- Productivity – generate more output from given resources
- Quality – create something new
Language
"It is argued that language plays an active role in the development of scientific ideas. ...
And is mathematics somehow more or less than a language? ...
A particular characteristic of mathematics which appears in one aspect to differentiate it from language is its appeal to visual thinking."
Alan Ford and F. David Peat (1988): "The Role of Language in Science."
"As I gradually improved my in-code documentation, I realized that English is a natural language, but computer languages, regardless of how well we use them, are still 'code.' Communication via natural language is a relatively quick and efficient process. Not so with computer languages: They must be 'decoded' for efficient human understanding."
David Zokaities (2004): "Writing Understandable Code".
Today's trinity of scientifc languages:
- the spoken/written language – in general English
- the formal language – logic, mathematics, etc.
- the programming language – Python, for example
Python seems to be the natural completion of the scientific language stack:
English
"Calculate the inner values of an option at maturity with strike of 105 for 10,000 simulated prices of stock S."
Mathematics
Python/NumPy
S0 =100
K = 105
I = 10000
ST = S0 * standard_normal(I)
h = maximum(ST - K, 0)
Scientific publishing has been revolutionized by Latex and its derivatives through combining
- word processing with
- mathematical formula rendering capabilities
The researcher can by herself/himself generate publication-ready output in a highly customizable fashion.
Then, when the need came up,
- syntax highlighting capabilities were added (e.g. for Python)
Nowadays, the tools available in the Python space take all this one step further.
- Sphinx
- IPython Notebook
- PythonTEX
What exactly does this mean?
- Executable Code as part of the document sources for automatic inclusion of the code's results.
- Open Research with reproducable results for everyone interested.
- Higher Efficiency, Productivity, Quality
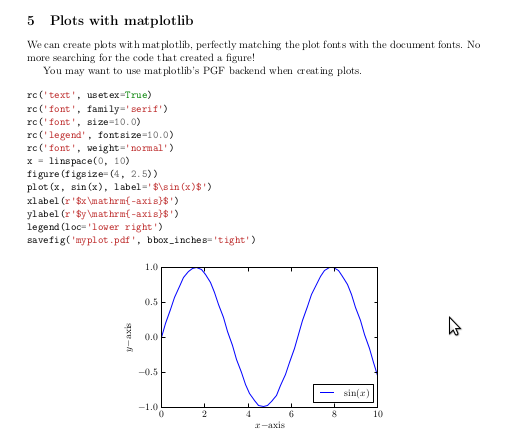
#  \section{Plots with matplotlib}

#  We can create plots with matplotlib, perfectly matching the plot fonts with the document fonts.
#  No more searching for the code that created a figure!

#  You may want to use matplotlib's PGF backend when creating plots.

#  \begin{pylabblock}
#  rc('text', usetex=True)
#  rc('font', family='serif')
#  rc('font', size=10.0)
#  rc('legend', fontsize=10.0)
#  rc('font', weight='normal')
#  x = linspace(0, 10)
#  figure(figsize=(4, 2.5))
#  plot(x, sin(x), label='$\sin(x)$')
#  xlabel(r'$x\mathrm{-axis}$')
#  ylabel(r'$y\mathrm{-axis}$')
#  legend(loc='lower right')
#  savefig('myplot.pdf', bbox_inches='tight')
#  \end{pylabblock}

#  \begin{center}
#  \includegraphics{myplot}
#  \end{center}
Source www.github.com.
Source www.github.com.
Efficiency
To reach a given goal with minimal resources.
Genome Sequencing
Using Python to generate faster research results.
"Saturday, June 22, 2013
Python for Next-Generation Sequencing
... a story about how a challenging genome sequencing project demonstrated once again, what an awesome tool Python can be ...
Here are the results from one million regular expression searches of a genome of 250 million bases:
- Number of matches found in sequence = 61,226
- 1,000,000 searches completed in 0.671034 seconds
- Mean search time = 6.71034e-07 seconds
Fast! ...
Like much of the Python Standard Library, the re module that handles regular expressions is actually written in C, so while the initial function call to the search may be handled by the Python interpreter, the subsequent search is actually being run in compiled native code, which explains its efficiency."
Source www.digitalbiologist.com.
Just-in-Time Compiling
Reducing execution time.
Let's start with pure Python.
def f(m, n):
    total = 0.0
    for i in range(m):
        for j in range (n):
            total += sin(i * j)
    return total
m = 1000
n = m
%time f(m, n)
The compiled version.
import numba
f_jit = numba.autojit(f)
%time f_jit(n, m)
The NumPy solution.
def f_np(m, n):
    v1 = resize(arange(m), (n, m))
    v2 = resize(arange(n), (m, n))
    v = v1 * v2.T
    return m * n, sum(sin(v))
%time f_np(m, n)
Productivity
To generate maximum output given your resources.
Parallel Execution of Code
Increasing the output given a certain algorithm and hardware.
The algorithm we (arbitrarily) choose is the Monte Carlo estimator for a European option in the Black-Scholes-Merton set-up.
$$dS_t = r S_t dt + \sigma S_t dZ_t$$
def BSM_MCS(S0):
    ''' Black-Scholes-Merton MCS Estimator for European Calls. '''
    import numpy as np
    K = 100.; T = 1.0; r = 0.05; vola = 0.2
    M = 50; I = 20000
    dt = T / M
    rand = np.random.standard_normal((M + 1, I))
    S = np.zeros((M + 1, I)); S[0] = S0
    for t in range(1, M + 1):
        S[t] = S[t-1] * np.exp((r - 0.5 * vola ** 2) * dt + vola * np.sqrt(dt) * rand[t])
    BSM_MCS_Value = np.sum(np.maximum(S[-1] - K, 0)) / I
    return BSM_MCS_Value
The benchmark case of sequential execution.
from time import time
n = 100
def seqValue():
    optionValues = []
    for S in linspace(80, 100, n):
        optionValues.append(BSM_MCS(S))
    return optionValues
t0 = time()
seqValue()
t1 = time(); d1 = t1 - t0
print "Number of Options   %8d" % n
print "Duration in Seconds %8.3f" % d1
print "Options per Second  %8.3f" % (n / d1)
We initialize the parallel execution infrastructure.
# shell: ipcluster start -n 2
from IPython.parallel import Client
cluster_profile = "default"
c = Client(profile=cluster_profile)
view = c.load_balanced_view()
The function for the parallel execution of a number of different options valuations.
def parValue():
    optionValues = []
    for S in linspace(80, 100, n):
        value = view.apply_async(BSM_MCS, S)
        # asynchronously calculate the option values
        optionValues.append(value)
    return optionValues
The case of parallel execution.
def execution():
    optionValues = parValue()  # calculate all values
    print "Submitted tasks     %8d" % len(optionValues)
    c.wait(optionValues)
    return optionValues
t0 = time()
optionValues = execution()
t1 = time(); d2 = t1 - t0
print "Duration in Seconds %8.3f" % d2
print "Options per Second  %8.3f" % (n / d2)
Interactive Financial Analysis
Maximizing an analyst's output given his daily (weekly, monthly) capacity.
Daily Stock Price Data
Reading and analyzing daily stock price data.
import pandas as pd
import pandas.io.data as pdd
AAPL = pdd.DataReader('AAPL', data_source='yahoo', start='1/1/2003')
# retrieve Apple stock prices from Yahoo Finance since 2003
AAPL['60d'] = pd.rolling_mean(AAPL['Close'], window=60)
AAPL[['Close', '60d']].plot(grid=True)

High-Frequency Stock Price Data
Reading intraday, high-frequency data from a Web source, resampling and plotting it.
url = 'http://hopey.netfonds.no/posdump.php?date=20130701&paper=AAPL.O&csv_format=csv'
AAPL = pd.read_csv(url, index_col=0, header=0, parse_dates=True)
AAPL
AAPL_10min = AAPL.resample(rule='10min', how='mean')
AAPL_10min['bid'].plot()

Quality
Doing new things.
Better Investment Decisions through Regulation
Using Python to making contractual features of ABS transparent.
To increase the ability of investors to assess the quality and mechanisms behind Asset Backed Sercurities (ABS) – those responsible for the financial crisis of 2007/2008 – the Securities and Exchange Commission (SEC) proposed in 2010 to use Python Programs (with XML files) to exactly describe their contractual Flow of Funds ("waterfall").
“We are proposing to require that most ABS issuers file a computer program that gives effect to the flow of funds, or 'waterfall,' provisions of the transaction. We are proposing that the computer program be filed on EDGAR in the form of downloadable source code in Python. Python, as we will discuss further below, is an open source interpreted programming language. Under our proposal, an investor would be able to download the source code for the waterfall computer program and run the program on the investor’s own computer (properly configured with a Python interpreter). The waterfall computer program would be required to allow use of the asset data files that we are also proposing today. This proposed requirement is designed to make it easier for an investor to conduct a thorough investment analysis of the ABS offering at the time of its initial investment decision.”
Source SEC Proposal (2010), pp. 205-206.
Analyzing and Explaining the Universe
Using Python for Cosmological and Open Research

Source www.arxiv.org.
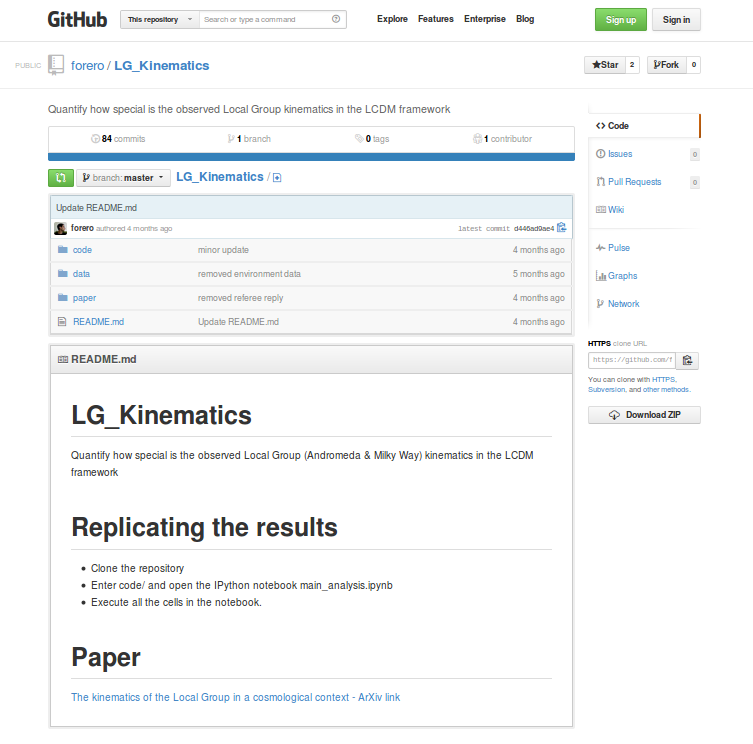
Source www.github.com.
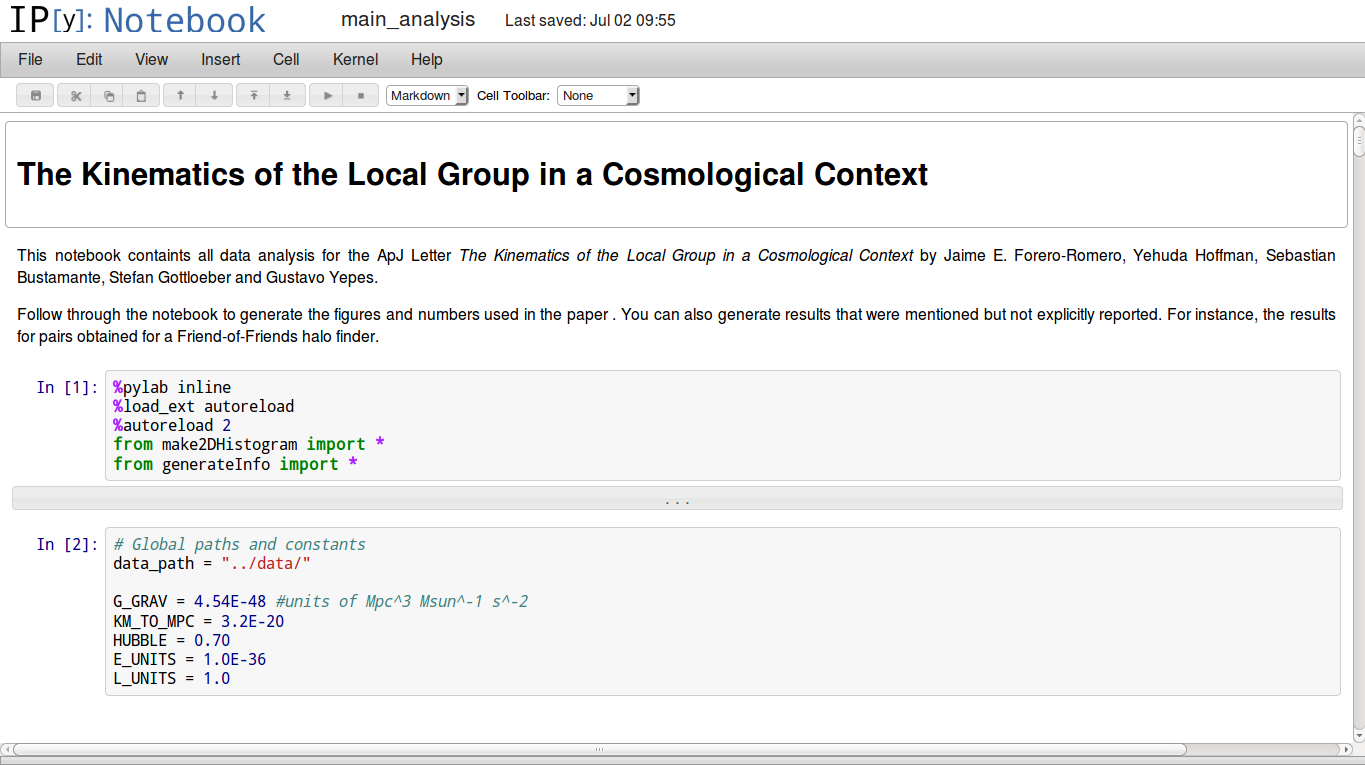
Source www.github.com.
Value Added Services with Python
Using Python to communicate financial theory and derivative product features.
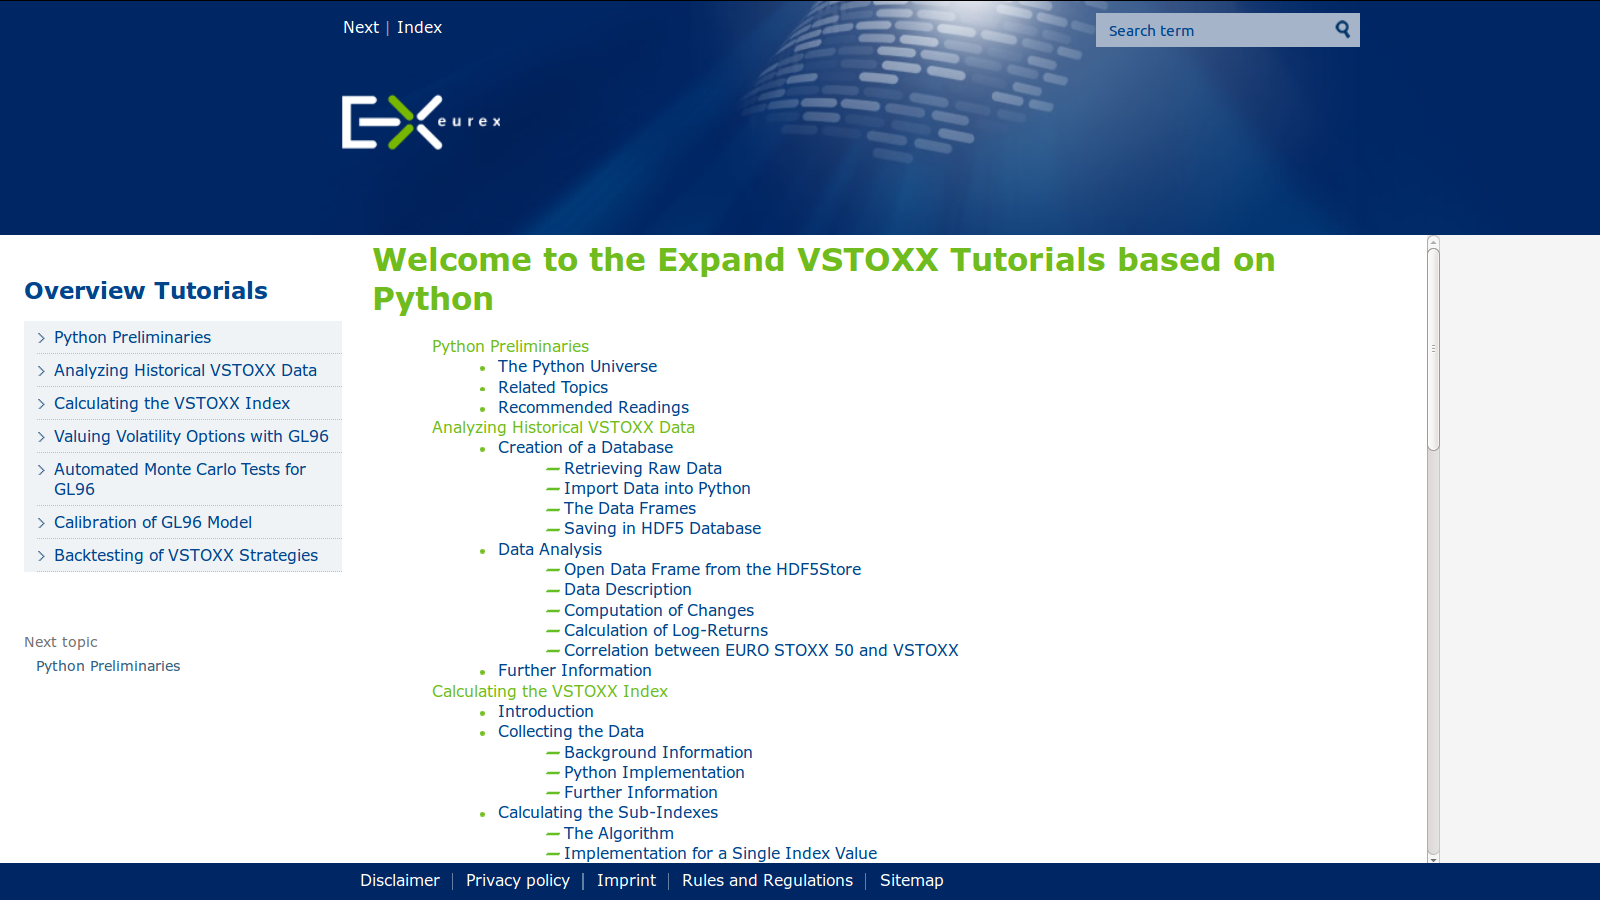
Eurex, one of the leading derivatives exchanges, recently launched a new Python-based marketing initiative called VSTOXX® Advanced Services.
"VSTOXX® Advanced Services
Benefits for professional trading. Free!
Futures and options on the VSTOXX® give investors and traders a targeted and leveraged means to take a view on European volatility, based on the implied volatility derived from EURO STOXX 50® Index Options. Portfolio diversification and optimizing volatility exposure are amongst the strongest reasons to access volatility via VSTOXX® derivatives.
Our advanced VSTOXX® Services offer a number of added benefits for professional trading. On the following pages you will find a wealth of information – tutorials, scripts and tools for back testing – that help you efficiently analyze data related to the VSTOXX® volatility index, understand how the VSTOXX® volatility index is calculated and how you can value derivatives written on the VSTOXX® index."
Source www.eurexchange.com.
Source www.eurexchange.com.
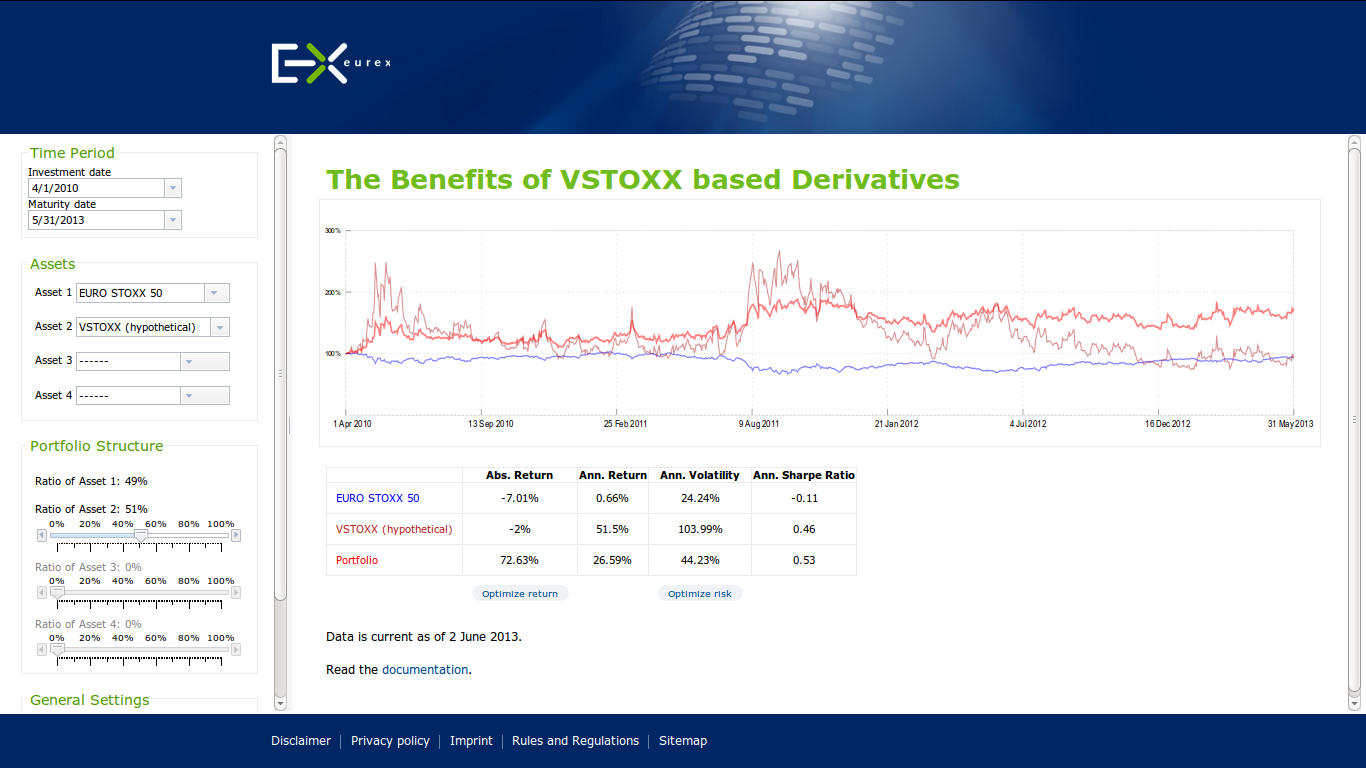
Source www.eurexchange.com.
The VSTOXX® Advanced Services do
- provide an educational one-stop offering regarding the VSTOXX® and related derivatives
- provide the necessary theoretical background in a concise yet complete fashion
- provide Python scripts that are self-contained, illustrate the theoretical concepts and that are immediately applicable
In economic terms, the project obviously shall facilitate trading in the respective products to increase liquidity. This should be mainly reached by lowering barriers of entry to this cutting edge product class.
The main tool used is "applicable transparency" through providing executable Python scripts.
Major target groups are:
- traders
- investors
- risk managers
- quants
- developers
- researchers
- teachers/students
Why Python?
- Open Source
- Concise "Mathematical" Syntax
- Financial Features
- General Purpose Language
- Long-Term Strategic View
Which libraries & tools?
- NumPy
- pandas
- SciPy
- matplotlib
- PyTables
- Sphinx
... the standard scientific stack.
Web-based, Collaborative Data Analytics
... and Development, Visualization, Presentation, Publication, Documentation
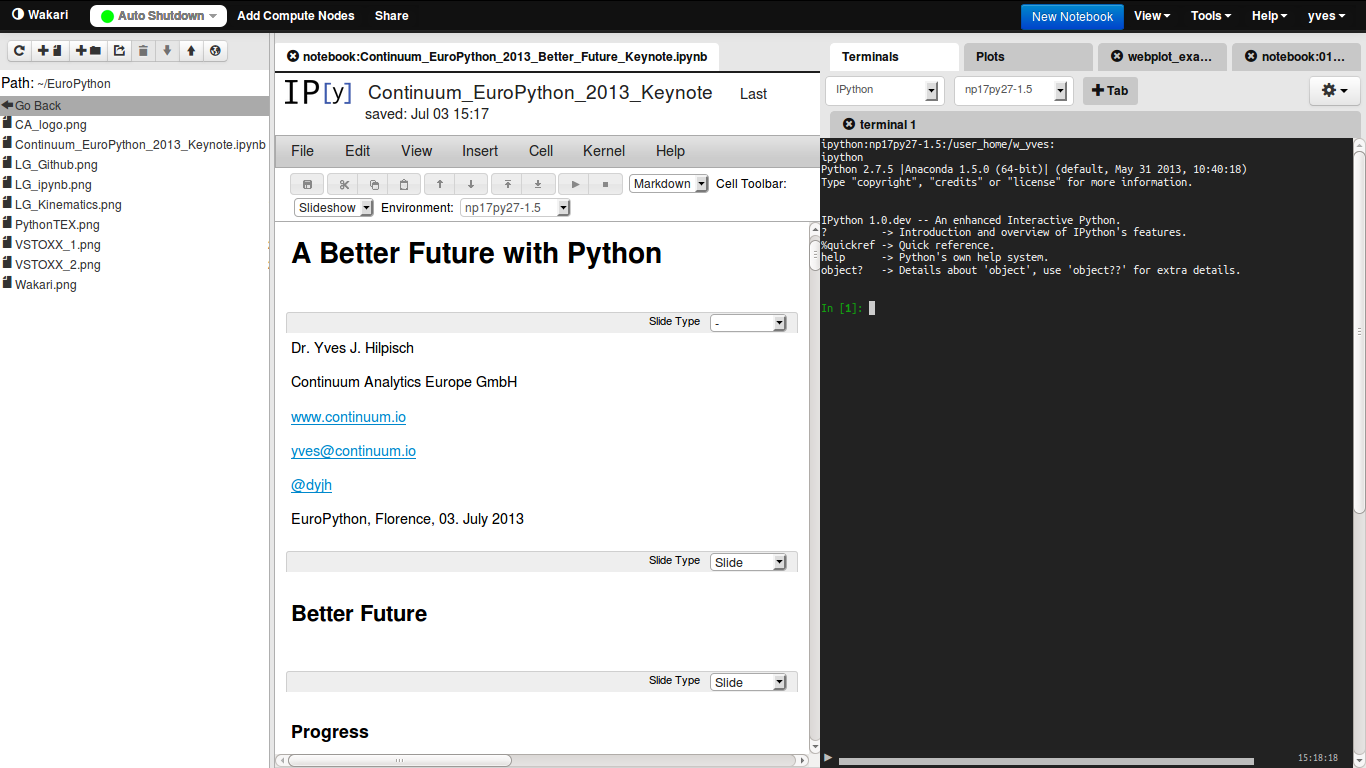
Source www.wakari.io.
Maybe Our Biggest Challenge ...
... to make the use of Python as simple and reliable as possible
As a community, we should put our emphasis, among others, maybe even more on topics like:
- Education – at schools, universities, in trainings, through books
- Installation – distribution (e.g. Anaconda), Web services (e.g. Wakari.io), packaging (e.g. Binstar.org)
- Standardization – language (2 vs. 3), style (PEP 8), documentation (Sphinx)
- Building Services – professionally supporting libraries, packages, distributions
![]()
The Python Quants GmbH – Experts for Python in Quant Finance
The Python Quants GmbH – the company Web site
Dr. Yves J. Hilpisch – my personal Web site
Derivatives Analytics with Python – my new book
Read an Excerpt and Order the Book
Contact Us